
Welcome to our in-depth exploration of Java Microbenchmarking Harness, commonly known as JMH. In this comprehensive guide, we will delve deep into the world of microbenchmarking in Java. You’ll discover how JMH can help you measure, analyze, and optimize the performance of your Java applications. Let’s embark on this journey to uncover the secrets of JMH.
What is JMH?
Java Microbenchmarking Harness (JMH) is a powerful and versatile tool designed specifically for benchmarking Java code. It provides a standardized way to measure the performance of your Java applications, helping you identify bottlenecks, optimize critical sections, and make data-driven decisions.
The Importance of Benchmarking
Benchmarking is a crucial practice in software development, especially when it comes to optimizing code for performance. By benchmarking your code, you can:
- Identify performance bottlenecks;
- Compare different implementations;
- Ensure your changes lead to performance improvements.
Setting Up JMH
Before we dive into benchmarking with JMH, it’s essential to set up your environment correctly. Let’s walk through the necessary steps.
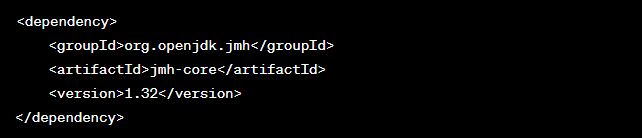
Step 1: Adding JMH as a Dependency
To begin using JMH, add it as a dependency to your Java project. You can do this by including the following Maven dependency:
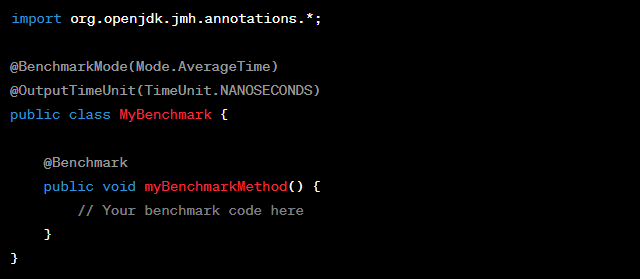
Step 2: Creating a Benchmark Class
In JMH, benchmarks are represented by Java classes. Create a new Java class to define your benchmarks. Here’s an example of a simple benchmark class:
Running Benchmarks with JMH
Now that you have your benchmark class set up, it’s time to run some benchmarks.
Step 3: Running Benchmarks
To execute your benchmarks, you can use the following command:

Replace my-benchmark.jar with the name of your compiled benchmark class.
Analyzing JMH Results
Once your benchmarks are executed, JMH provides detailed results that can help you analyze and optimize your code further. Let’s explore how to interpret these results.
Understanding JMH Output
JMH generates various metrics and statistics, including:
- Average Time: The average time taken for the benchmarked operation;
- Throughput: The number of operations per unit of time;
- Operations per Second: Similar to throughput but measured in operations per second;
- Percentiles: Measures of the distribution of times.
Best Practices for JMH Benchmarking
To make the most of JMH, follow these best practices:
- Ensure your benchmarks are isolated and do not depend on each other;
- Run benchmarks on a clean JVM to avoid interference from previous runs;
- Use state objects to hold benchmark-specific data;
- Pay attention to warm-up iterations to achieve stable results.
Advanced JMH Techniques
Now that you have a solid foundation in using JMH for Java microbenchmarking, let’s explore some advanced techniques and strategies to get even more out of this powerful tool.
1. Benchmark Modes
JMH offers different benchmark modes, each suited for specific testing scenarios:
- Throughput: Measures the number of operations per unit of time. Ideal for testing how well your system performs under load;
- Average Time: Focuses on the average execution time of a benchmarked operation. Helpful for understanding the typical performance of your code;
- Sample Time: Samples the time taken by the benchmark method at specific intervals. Useful for analyzing variations in performance;
- Single Shot Time: Executes the benchmark method only once. Suitable for measuring the cold start performance of a method.
2. Profiling with JMH
Profiling is an essential part of optimizing your Java applications. JMH allows you to integrate profiling tools like Java Flight Recorder (JFR) or Async Profiler into your benchmarks. This enables you to identify performance bottlenecks, memory leaks, and CPU usage patterns with precision.
3. Custom Annotations
You can create custom annotations to streamline the benchmarking process. For instance, if you often use specific settings or configurations, define a custom annotation to apply them consistently across multiple benchmarks. This promotes code reusability and maintains a clean and organized benchmarking suite.
4. Parameterized Benchmarks
Sometimes, you need to benchmark the same code with different inputs or configurations. JMH supports parameterized benchmarks, allowing you to run the same benchmark method with various sets of parameters. This feature is invaluable for testing how your code performs under different conditions.

Common Pitfalls in JMH Benchmarking
While JMH is a powerful tool, it’s essential to be aware of common pitfalls that can affect the accuracy and reliability of your benchmarks. Here are some pitfalls to watch out for:
Warm-up and Warm-up Iterations
In JMH, warm-up iterations are crucial to ensure the JVM reaches a stable state before measurements begin. Failing to configure warm-up iterations correctly can lead to skewed results. Ensure that your warm-up iterations are sufficient to eliminate JVM warm-up effects.
Benchmarking Small Workloads
Benchmarking small code snippets or methods with very short execution times can introduce measurement errors due to the overhead of JMH itself. It’s recommended to increase the workload or execution time to obtain more accurate results.
Non-Deterministic Code
If your benchmarked code contains non-deterministic elements, such as random number generation or external dependencies, you may get inconsistent results. Consider isolating these elements or using appropriate JMH features to control randomness during benchmarking.
Neglecting JVM Flags
JVM flags and settings can significantly impact benchmark results. Ensure that you configure the JVM correctly for your specific use case. Experiment with different JVM settings to optimize your benchmarks.
Integrating JMH into Your Development Workflow
Now that you’ve mastered the fundamentals and advanced techniques of JMH, it’s time to discuss how to seamlessly integrate microbenchmarking into your software development workflow. Here are some practical steps to make JMH an integral part of your development process:
1. Continuous Integration (CI) and Automation
Key Steps for Integrating JMH into CI/CD
| Step | Description |
|---|---|
| 1 | Set up a CI pipeline that runs JMH benchmarks |
| 2 | Ensure benchmarks run automatically on code commits |
| 3 | Monitor benchmark results for performance regressions |
| 4 | Fail the build if performance degrades beyond acceptable limits |
Automating the execution of JMH benchmarks in your CI/CD pipeline allows you to catch performance regressions early in the development cycle. By monitoring benchmark results automatically, you can ensure that code changes do not negatively impact your application’s performance.
2. Profiling and Code Optimization
Incorporating JMH into the Profiling and Optimization Workflow
- Run JMH benchmarks before and after making performance-related code changes;
- Integrate JMH with profiling tools like Java Mission Control (JMC) or VisualVM to identify hotspots;
- Analyze JMH results alongside profiling data to pinpoint bottlenecks;
- Make targeted optimizations based on combined JMH and profiling insights.
Combining JMH with profiling tools provides a comprehensive view of your application’s performance. It allows you to optimize code with confidence, knowing that your changes are backed by empirical data.
3. Performance Documentation
Documenting Performance Improvements with JMH
| Document | Description |
|---|---|
| 1 | Maintain a performance improvement log |
| 2 | Record JMH benchmark results in the log |
| 3 | Document the code changes associated with each improvement |
| 4 | Include information on how JMH influenced the optimization process |
Creating a performance improvement log that includes JMH benchmark results and details of code changes helps your team track progress and understand the impact of optimizations. This documentation also serves as a valuable resource for future performance-related tasks.
JMH Best Practices and Beyond
As you continue to explore JMH and its applications, it’s important to keep refining your benchmarking skills. Here are some additional best practices and advanced topics to consider:
1. Cross-Version Benchmarking
Cross-Version Benchmarking with JMH
- Benchmark your code across different Java versions (e.g., JDK 8, 11, 17) to detect performance variations;
- Use JMH to identify performance differences between various JVM implementations (e.g., OpenJDK, Oracle JDK, GraalVM).
Cross-version benchmarking with JMH helps you ensure that your code performs consistently across different Java environments, which is crucial for maintaining compatibility.
2. Custom Profilers
Using Custom Profilers with JMH
| Profiler | Description |
|---|---|
| 1 | Explore the use of custom profilers tailored to your needs |
| 2 | Implement custom profilers to collect specific performance data |
| 3 | Integrate custom profilers seamlessly with JMH for analysis |
Custom profilers can provide deeper insights into specific aspects of your application’s performance. Integrating these profilers with JMH allows for fine-grained analysis and optimization.
3. Benchmarking Non-Functional Aspects
Beyond Performance – Benchmarking Non-Functional Aspects
- Extend JMH to benchmark non-functional aspects like memory usage, thread concurrency, and resource consumption;
- Use JMH to validate compliance with non-functional requirements, such as response times and scalability.
JMH can go beyond performance benchmarking, helping you assess and validate other critical non-functional aspects of your Java applications.

Conclusion
In this comprehensive guide, we’ve explored the world of Java Microbenchmarking Harness (JMH). You’ve learned how to set up JMH, run benchmarks, analyze results, and follow best practices for effective microbenchmarking. With JMH, you can fine-tune your Java applications and achieve optimal performance.
FAQs
Microbenchmarking focuses on measuring the performance of small code snippets or specific functions, while regular benchmarking evaluates the overall performance of an application.
No, JMH is specifically designed for benchmarking Java code and may not be suitable for other programming languages.
Yes, alternatives like Caliper and Apache JMeter exist, but JMH is widely recognized as one of the best tools for Java microbenchmarking.
To benchmark large-scale applications, break them down into smaller, testable components and create separate JMH benchmarks for each component.
Yes, JMH supports benchmarking multi-threaded Java code. You can configure the number of threads and thread groups for your benchmarks.