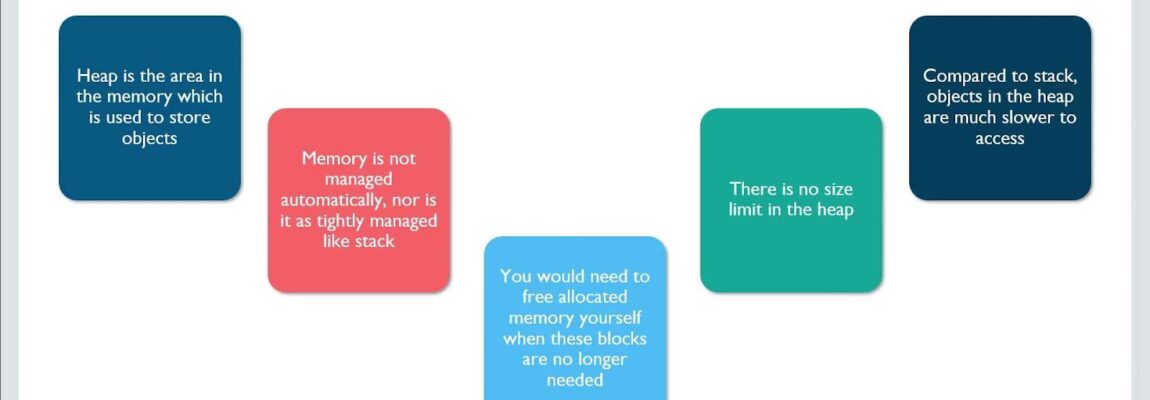
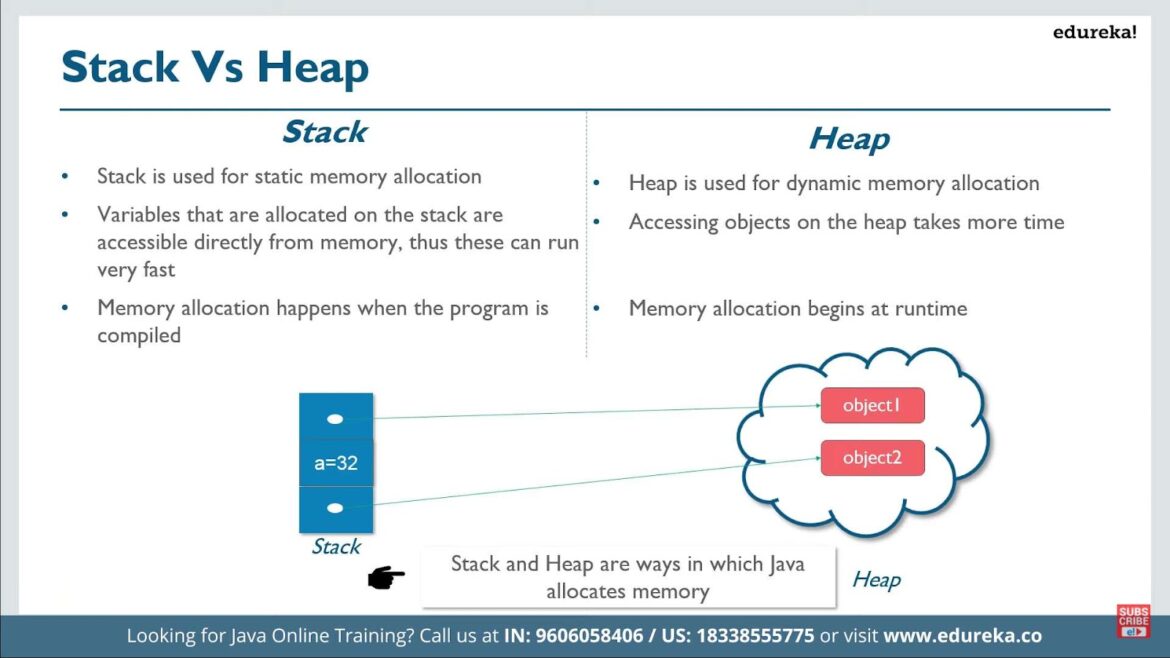
When you engage in Java programming, the performance of your application becomes intimately tied to the efficient management of memory, especially when dealing with substantial heap sizes. The heap, a designated portion of a computer’s memory arena, serves as a repository for global variables, which Java expertly utilizes for object storage. As your application’s heap size exceeds the 32GB threshold, a myriad of intricate issues and obstacles may surface, necessitating precise and thorough strategies for managing and optimizing operations to guarantee a smooth and effective workflow.
Exploring Java Heap Space: A Developer’s Guide
Java Heap Space, an integral component of the Java Virtual Machine (JVM), serves as the backstage for Java runtime objects. As developers, mastering this arena is not just advantageous but often imperative. Failure to do so can result in memory leaks and performance bottlenecks that can cripple even the most robust applications. This becomes especially pertinent when grappling with colossal applications, where the heap size eclipses the 32GB threshold. In this comprehensive guide, we delve into the nuances of Java Heap Space management, offering strategies and insights to help developers navigate the complexities of optimizing memory usage.
Optimizing Heap Space Beyond 32G: Strategies for Success
Once the heap size crosses the 32GB mark, an intriguing phenomenon occurs: compressed ordinary object pointers (OOPs) are automatically disabled. These OOPs are efficient representations of Java objects, designed to minimize memory consumption. Losing access to them can lead to an undesirable spike in memory usage. To tackle this challenge head-on, developers should embrace a repertoire of optimization strategies:
- Progressive Garbage Collection: In the realm of Java’s memory administration, Garbage Collection (GC) often operates in the shadows, unobtrusively fulfilling the vital role of retrieving superfluous memory resources. When confronted with the daunting responsibility of overseeing extensive heap capacities, one should contemplate the implementation of a low-latency collector, exemplified by the esteemed G1 garbage collector. What sets this collector apart is its remarkable proficiency in effectively managing colossal heaps, all the while ensuring that application interruptions remain at a bare minimum;
- Fine-Tuning JVM Parameters: The art of optimizing large heaps begins with fine-tuning Java Virtual Machine (JVM) parameters. This entails skillfully adjusting settings like the initial and maximum heap size to align with your application’s unique requirements. By doing so, developers gain precise control over resource allocation, thereby significantly enhancing the performance of Java applications with extensive heap demands;
- Leveraging Memory-Efficient Data Structures: One of the most impactful ways to slash memory consumption is by adopting memory-efficient data structures and algorithms. Enter the realm of Trove collections and their kin. These specialized data structures can outshine their standard Java counterparts when it comes to memory efficiency, making them indispensable for optimizing performance in memory-intensive scenarios;
- Embracing Object Pooling: Object pooling, a well-known design pattern, proves its mettle when managing objects that come with a hefty creation cost. Instead of perpetually birthing new objects, this pattern encourages the judicious recycling of existing ones. The result? A performance boost coupled with a reduction in memory footprint. This becomes particularly pertinent when navigating the treacherous waters of heap sizes exceeding 32GB.
Comprehensive Application Surveillance and Evaluation Instruments
In managing Java applications that utilize expansive heap spaces, thorough surveillance and assessment mechanisms are paramount. A multitude of instruments are at developers’ disposal to aid them in pinpointing memory lapses, overseeing heap utilization, and evaluating application performance in a detailed manner. These mechanisms are invaluable for ensuring optimal functionality and efficient resource utilization in applications.
1. Java VisualVM: Multi-Dimensional Application Profiling Tool
Java VisualVM stands out as an integrated platform, offering an array of visual instruments designed to supervise, diagnose, and profile Java applications. It serves as a pivotal entity for scrutinizing memory usage and uncovering memory lapses, thereby facilitating developers in enhancing the efficiency of applications with heap exceeding 32G. It provides real-time application behavior insights, CPU and memory utilization trends, and can delve deep into Java processes to reveal concealed anomalies or performance bottlenecks. The value of Java VisualVM extends to its ability to streamline the analysis process, allowing quick identification of issues and ensuring optimal resource allocation and application performance.
2. JConsole: A Multifunctional Monitoring Utility
JConsole emerges as a highly adaptable surveillance utility, dispensing crucial data regarding the efficacy and resource exploitation of Java applications. It plays a vital role in spotlighting areas ripe for enhancement and guarantees the judicious consumption of memory in applications characterized by voluminous heap dimensions. JConsole not only contributes to the identification of potential enhancements but also supports informed decision-making regarding resource allocation and utilization, thereby reinforcing the overall robustness and responsiveness of Java applications. Its versatility is evidenced by its capability to monitor several performance attributes including memory consumption, thread count, and class loading, offering a panoramic view of application health.
3. Heap Dumps and Analytical Instruments: For In-depth Memory Investigation
Heap dumps stand as indispensable entities for unearthing memory leaks and refining object allocations, providing a snapshot of memory usage at a particular point in time. A variety of refined tools, such as Eclipse MAT, empower developers to delve into heap dumps, allowing them to unravel intricate details of memory consumption patterns within their applications. These instruments offer a comprehensive outlook on object retention, allocation, and disposal, granting insights that are crucial for pinpointing memory inefficiencies and optimizing application performance. By deciphering memory usage patterns and identifying the root causes of leaks, these tools facilitate the enhancement of application stability and resilience, enabling developers to rectify issues proactively and maintain high-quality application deliverance.
Troubleshooting Common Issues in Applications with Large Heap Sizes
Applications with heap sizes exceeding 32 gigabytes often face unique challenges that require specialized troubleshooting techniques. These challenges primarily revolve around addressing excessive memory consumption, minimizing extended garbage collection pauses, and effectively managing memory leaks. In this comprehensive guide, we’ll delve into each of these issues and provide valuable insights on how to resolve them for maintaining optimal performance.
Addressing Memory Leaks:
Memory leaks can be a silent performance killer, gradually increasing memory consumption and eventually causing application crashes. Identifying and resolving them is crucial. Here’s how to tackle this issue:
- Utilize Diagnostic Tools: Tools like Java VisualVM and heap dump analyzers are indispensable for detecting memory leaks. They provide detailed insights into memory usage, object references, and potential culprits;
- Heap Dump Analysis: When you suspect a memory leak, take a heap dump of your application. This snapshot of memory usage can be analyzed to pinpoint the objects that are not being released properly, helping you track down the leak source;
- Memory Leak Prevention: Implement best practices to prevent memory leaks in the first place. These practices include closing resources correctly, using weak references where appropriate, and regularly reviewing your codebase for potential issues.
Enhancing Garbage Collection Efficiency:
Efficient management of memory is crucial for recovering resources occupied by objects that are no longer in active use. Nevertheless, within applications boasting substantial memory heaps, inefficient garbage collection can lead to protracted interruptions and a marked downturn in performance. To optimize the process of garbage collection, consider the following strategies:
- Choose the Most Appropriate Garbage Collector: Carefully select the garbage collector that aligns most favorably with your application’s unique demands. Options such as G1, CMS, or Shenandoah come with distinct characteristics, and they can be meticulously tailored to accommodate your specific requirements;
- Fine-Tune JVM Parameters: Make precise adjustments to the JVM parameters, such as heap size, thread count, and pause time goals. These parameters wield significant influence over the behavior of garbage collection. Through experimentation, ascertain the optimal balance that suits the needs of your application;
- Garbage Collection Profiling: Routinely engage in garbage collection profiling, leveraging tools such as JConsole or Mission Control. Analyze the harvested data to unveil recurring patterns and identify bottlenecks, thereby serving as a guiding compass for your optimization endeavors;
- Implement Strategies for Minimal Pauses: Ponder strategies aimed at mitigating or eradicating extended pauses, including the utilization of concurrent collectors or the refinement of memory pool utilization.
Monitoring and Profiling:
Continuous monitoring and profiling of your application are essential for proactively addressing potential issues and inefficiencies:
- Real-time Monitoring: Implement real-time monitoring solutions to keep an eye on critical metrics such as CPU usage, memory utilization, and request response times. Tools like Prometheus and Grafana can help set up comprehensive monitoring dashboards;
- Alerting: Configure alerts to notify you when certain thresholds are breached. This allows you to respond swiftly to emerging issues before they impact users;
- Performance Profiling: Regularly profile your application using Java VisualVM, YourKit, or other profiling tools. This helps you identify performance bottlenecks, hotspots in your code, and areas for improvement;
- Thread Analysis: Analyze thread behavior to ensure efficient multithreading. Detecting thread contention and excessive locking can lead to significant performance gains.
Conclusion
The management and optimization of Java applications become considerably intricate when the heap size crosses the 32G threshold due to the loss of compressed ordinary object pointers. By employing strategies such as incremental garbage collection, fine-tuning JVM parameters, utilizing memory-efficient data structures, and leveraging object pooling, developers can optimize applications effectively.
Additionally, the role of monitoring and analysis tools like Java VisualVM and JConsole cannot be overstated in managing applications with large heap sizes. These tools, along with careful troubleshooting and regular profiling, are indispensable for maintaining the performance and stability of Java applications operating with extensive heap spaces.
In conclusion, mastering the complexities of managing over 32G heap size in Java applications requires a multifaceted approach involving optimization, monitoring, and continuous improvement to navigate the challenges and ensure the seamless functionality of applications. By dedicating time and effort to understand and implement these strategies and tools, developers can substantially enhance the efficiency and reliability of their large-scale Java applications.