Memory allocation is a critical aspect of Java programming that significantly impacts the performance, stability, and efficiency of your applications. In this comprehensive guide, we will delve deep into memory allocation in Java, exploring its core concepts, common challenges, and best practices for optimization. Whether you’re a novice or an experienced Java developer, understanding memory allocation is crucial to building robust and high-performing applications.
Understanding Memory Allocation in Java
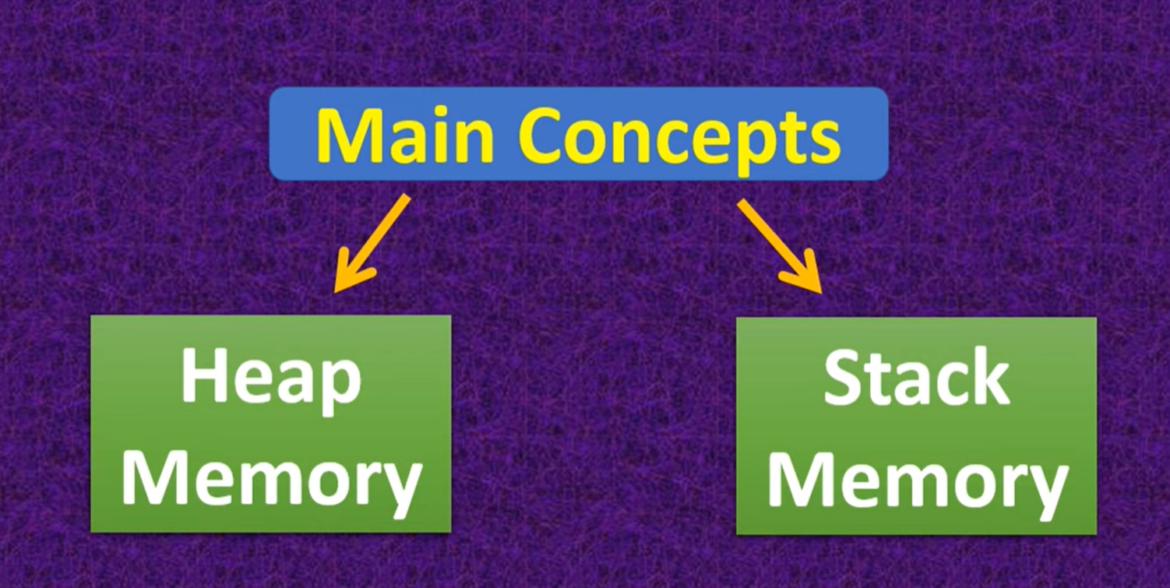
Java, as a managed memory language, automates memory allocation and management through the Java Virtual Machine (JVM). Two primary areas of memory allocation in Java are the heap and the stack.
| Memory Type | Description |
|---|---|
| Heap Memory | The heap is the primary area for object storage in Java. Objects created using the ‘new’ keyword are allocated memory in the heap. This memory is managed by the garbage collector, which reclaims memory from objects that are no longer in use. |
| Stack Memory | Stack memory is used for storing method call frames, local variables, and reference variables. It operates on a Last-In, First-Out (LIFO) basis. Method frames are pushed onto the stack when a method is called and popped off when the method completes execution. |
Garbage Collection in Java
Garbage collection is an essential part of Java’s memory management. It identifies and reclaims memory from objects that are no longer reachable or in use. However, improper object referencing can hinder the garbage collector’s efficiency. To optimize memory allocation and garbage collection:
- Nullify References: Set object references to null when they are no longer needed. This allows the garbage collector to reclaim memory more efficiently;
- Use Try-With-Resources: When working with resources like files, streams, or sockets, employ the try-with-resources statement to ensure timely resource release.
Object Pooling
Object pooling is a memory optimization technique that plays a crucial role in efficient memory allocation within Java applications. Instead of repeatedly creating and destroying objects, object pooling involves pre-allocating a pool of objects that can be reused as needed. This approach significantly reduces the overhead associated with object creation and destruction, making it particularly useful for managing short-lived objects like database connections, threads, or network sockets. By implementing object pooling, developers can minimize memory fragmentation and allocation delays, ultimately enhancing the overall performance and stability of their Java applications.
String Handling Optimization
Expanding upon the topic of efficient string handling in Java, it’s crucial to highlight the significance of choosing the right approach for string concatenation. While both StringBuilder and StringBuffer classes offer mutable string operations, they provide a substantial advantage over traditional string concatenation using the + operator.
When you use the + operator for string concatenation, a new string object is created every time, which can result in excessive memory consumption, especially when dealing with multiple concatenations within a loop or a complex algorithm. These unnecessary string creations contribute to memory fragmentation and negatively impact your application’s performance.
In contrast, StringBuilder and StringBuffer maintain a dynamic, mutable buffer where string operations can be performed efficiently. They modify the existing string in-place, eliminating the need to create new string objects repeatedly. This not only conserves memory but also significantly enhances the speed and responsiveness of your code, especially when dealing with extensive or repetitive string manipulations.
By opting for StringBuilder or StringBuffer over the + operator, you harness the power of mutable string operations, ensuring that your Java application manages memory allocation more efficiently, resulting in improved overall performance and resource utilization.
Choosing the Right Data Structures
When it comes to optimizing memory allocation in Java, the choice of data structures plays a pivotal role in shaping the efficiency and performance of your applications. It’s essential to recognize that not all data structures are created equal in terms of memory efficiency. By making informed decisions about which data structure to employ, developers can achieve substantial memory optimization.
For instance, consider the scenario of working with a fixed-size collection. In such cases, opting for arrays over ArrayLists can be a memory-saving choice. Arrays have a fixed size and allocate memory for elements in a contiguous block. This predictable memory allocation pattern minimizes memory overhead since there’s no need for the dynamic resizing mechanisms employed by ArrayLists. Consequently, by choosing the right data structure for specific use cases, you can not only reduce memory consumption but also ensure that your Java applications run smoothly and efficiently, delivering an enhanced user experience.
Monitoring and Profiling
In the pursuit of optimal memory allocation and overall performance excellence, monitoring and profiling your Java applications emerge as indispensable practices. Employing specialized tools such as VisualVM or YourKit empowers developers to gain deep insights into their application’s behavior and resource utilization.
Regular monitoring and profiling provide a window into your application’s inner workings, enabling the early detection of memory leaks, performance bottlenecks, and other critical issues. By identifying and addressing these concerns proactively, developers can fine-tune memory allocation strategies and optimize their codebase effectively.
These profiling tools offer valuable performance metrics, such as memory consumption patterns, CPU usage, and execution bottlenecks. Armed with this information, developers can make informed decisions, refactor code where necessary, and implement targeted optimizations to enhance application responsiveness and resource efficiency.
Embracing monitoring and profiling as integral components of your development workflow not only facilitates the early detection and resolution of memory-related issues but also empowers you to continuously refine your Java applications, ensuring they operate at peak performance levels and deliver a seamless user experience.
Leveraging Java 8+ Features
Expanding upon the utilization of Java 8+ features, it’s essential to highlight the transformative impact that these enhancements have brought to memory optimization in Java applications. Java 8 ushered in a new era of programming with features like the Stream API, which can be a game-changer when dealing with substantial data sets.
- Streams, as a powerful addition to the Java ecosystem, introduce a paradigm shift in how data is processed. They offer the compelling advantage of lazy evaluation, which means that elements within a stream are processed only when needed. This feature is particularly beneficial when working with extensive data collections because it eliminates the need to create intermediate objects unnecessarily;
- Traditional data processing methods often involve creating multiple intermediate objects during transformations, which can lead to memory bloat, especially in memory-intensive applications. Streams, on the other hand, operate on the data in a more efficient and memory-conscious manner. They allow developers to perform operations on data elements without generating intermediary objects, thus significantly reducing memory consumption and enhancing the application’s overall efficiency.
Conclusion
Mastering memory allocation in Java is essential for building high-performance and reliable applications. By gaining a deep understanding of Java’s memory management, adhering to best practices, and employing optimization techniques, you can minimize memory overhead, enhance application responsiveness, and ensure a seamless user experience. Regular monitoring and profiling will enable you to identify and address memory-related issues, ensuring your Java applications perform at their best.